Bear markets are painful. Plain and simple. Looking back, there were numerous signs in mid-to-late 2017 a price bubble was forming. But then again, hindsight is always 20/20. It’s important (and if nothing else reassuring) to remember: we’ve been here before.
Bitcoin surged more than 10x in the second half of 2013, peaking over $1,000 after spending much of the year trading in the $90-$150 range. The crash that ensued following this parabolic price move was just as extreme as the one we’re experiencing today: BTC fell over 85% from its all-time high over the subsequent ~14 months and did not break to new highs for a little over three years.
Historic Bitcoin Price Drawdowns from Prior Highs
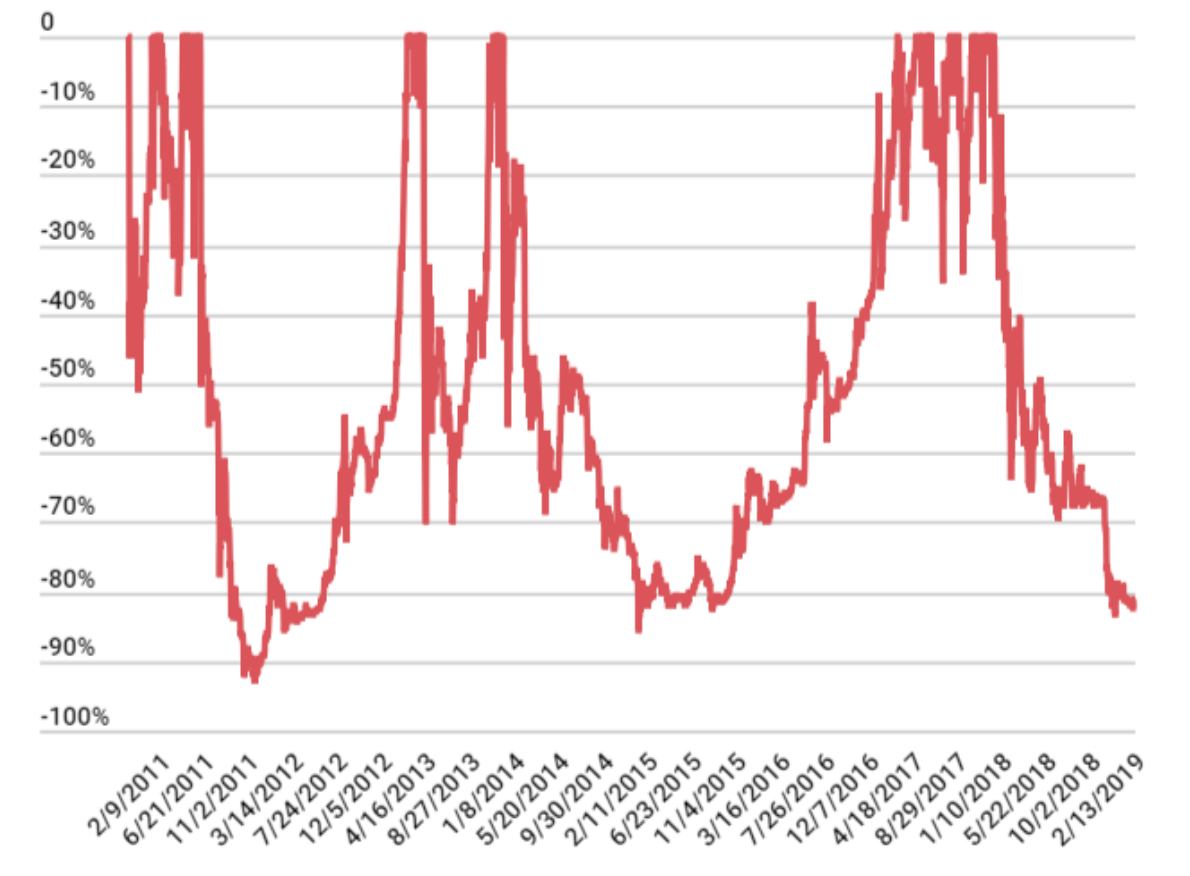
That sounds like a scary scenario, but we’re finally nearing the point where we can confidently state “the worst days are behind us” if history proves to be a reliable guide. Bitcoin is currently down ~81% since its December 2017 peak, roughly 14 months to the day, after touching ~83% at the tail end of 2018.
Current BTC Drawdown from Dec. 2017 vs. 2013 Cycle
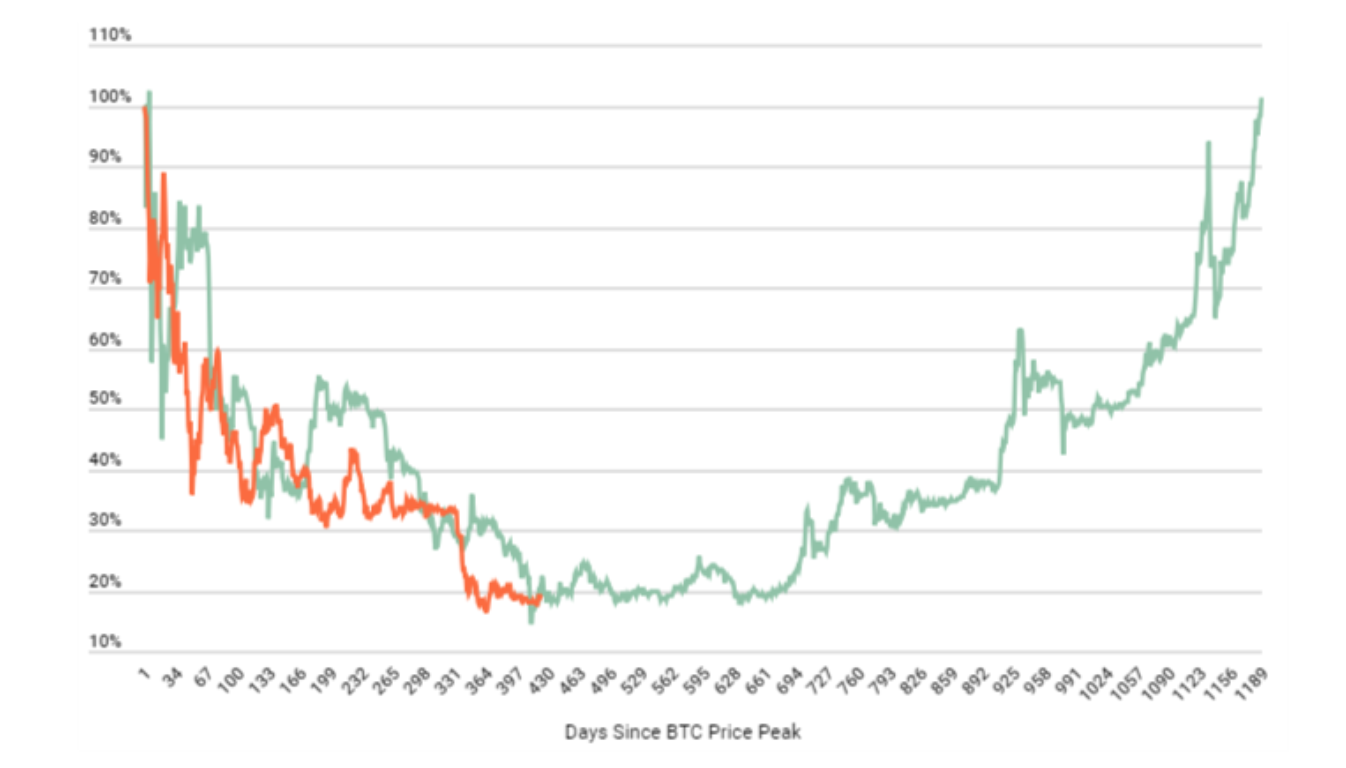
History doesn’t repeat itself, but it often rhymes. While the market conditions and general awareness of crypto is certainly different compared to just a few years ago, there are some interesting historical parallels we can make to help frame the current BTC cycle.
One near-term trend we are watching is the potential break below BTC’s 200-week moving average (MA), which is currently around $3,320. Bitcoin flirted with its 200-week MA in early December before rebounding back to above $4,000, but has since slid back below $3,600. We are monitoring any potential retest of its 200-week MA as a break to the downside could serve as a near-term catalyst for further selling.
BTC vs. 200-Week Moving Average
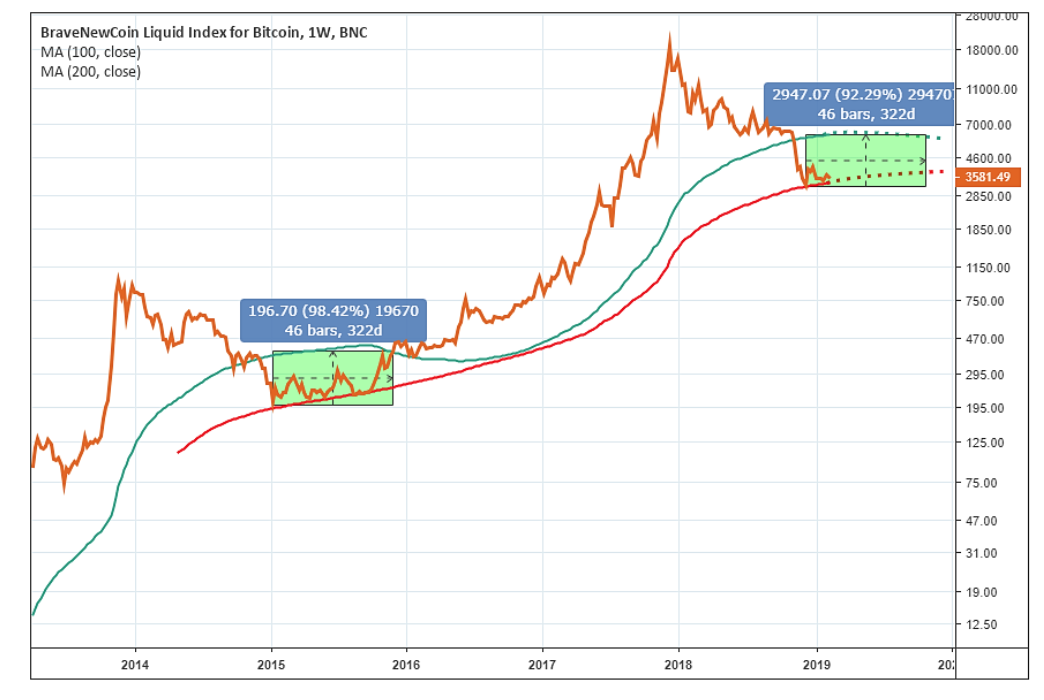
Bitcoin bounced off similar levels a few times during the prior cycle, but the 200-week MA proved to be a pretty tough support to break for any extended period of time. Although technical analysis in this market certainly has its drawbacks, this is a level we know many people are watching as well.
Momentum can also be a powerful driver of performance, especially in a market like crypto where sentiment often plays an outsized role in near-term price fluctuations. A longer-term momentum indicator we’ve been tracking is the 14-week relative strength index (RSI) for BTC, which dipped below 30 for the first time in approximately four years (this level is often used to indicate a particular asset or market is oversold). The last time this indicator dropped to these levels was in January 2015, which roughly coincided with the bottom of the last bear market.
BTC Price vs. 14-Week RSI
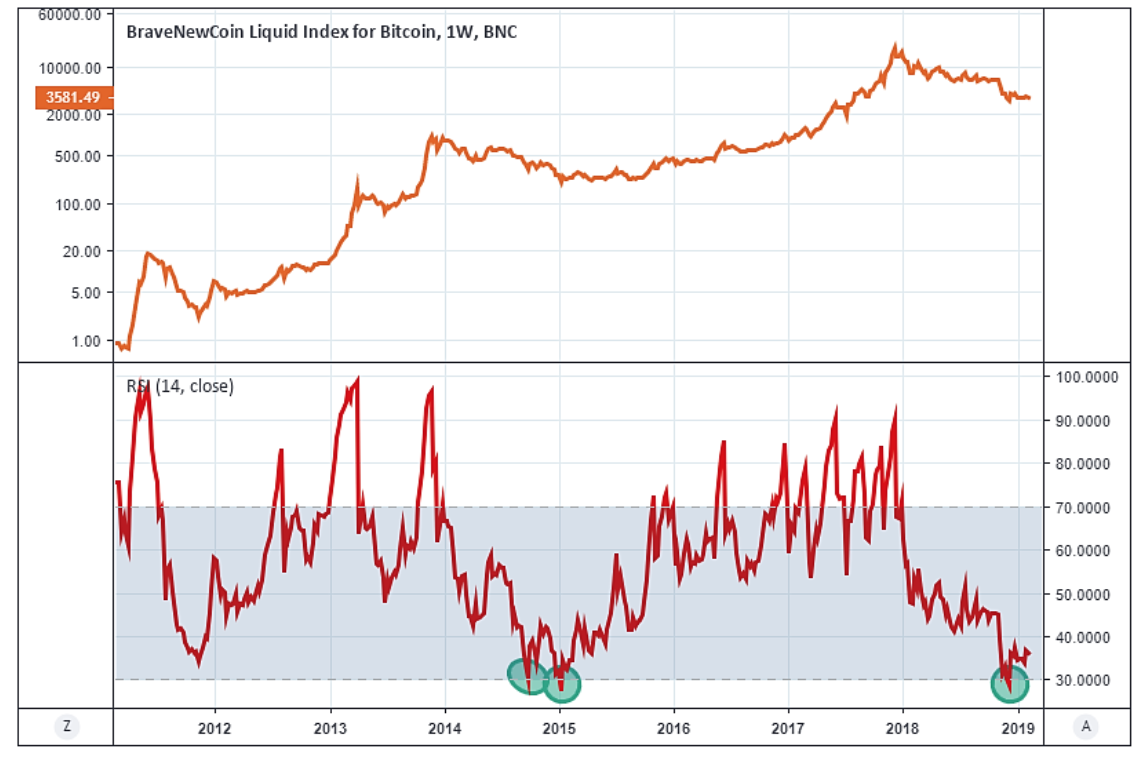
While we find solace in the similarities between historical BTC price cycles, we remain cautious in the near-term. Another leg down for crypto asset prices certainly wouldn’t tickle, but it may be necessary as the final signs of true capitulation in this market emerge. We still see significant upside risk over the next 12 months given the number of catalysts (ETF approval, etc.) that could propel BTC prices higher.
